Planning, Projects & Sprints
Everything you do for a client lives inside one screen: Manage → Planning (/planning). It replaced the four separate screens Vidiking used to have (Planner, Plans, Launch and Sprints) with a single spine — the Project.
"Planner", "Plans", "Launch" and "Sprints" were four screens for one job: running a client project. They're now unified under Planning. The old URLs (/planner, /plans, /sprints, /launch) still work — they redirect here.
Projects — the top level
A Project is one client engagement. Open Planning and you get a list of your projects; several projects can share the same client (the client is just a customerName label you can filter by — there's no separate client table to manage). Projects are unlimited on every subscription tier.
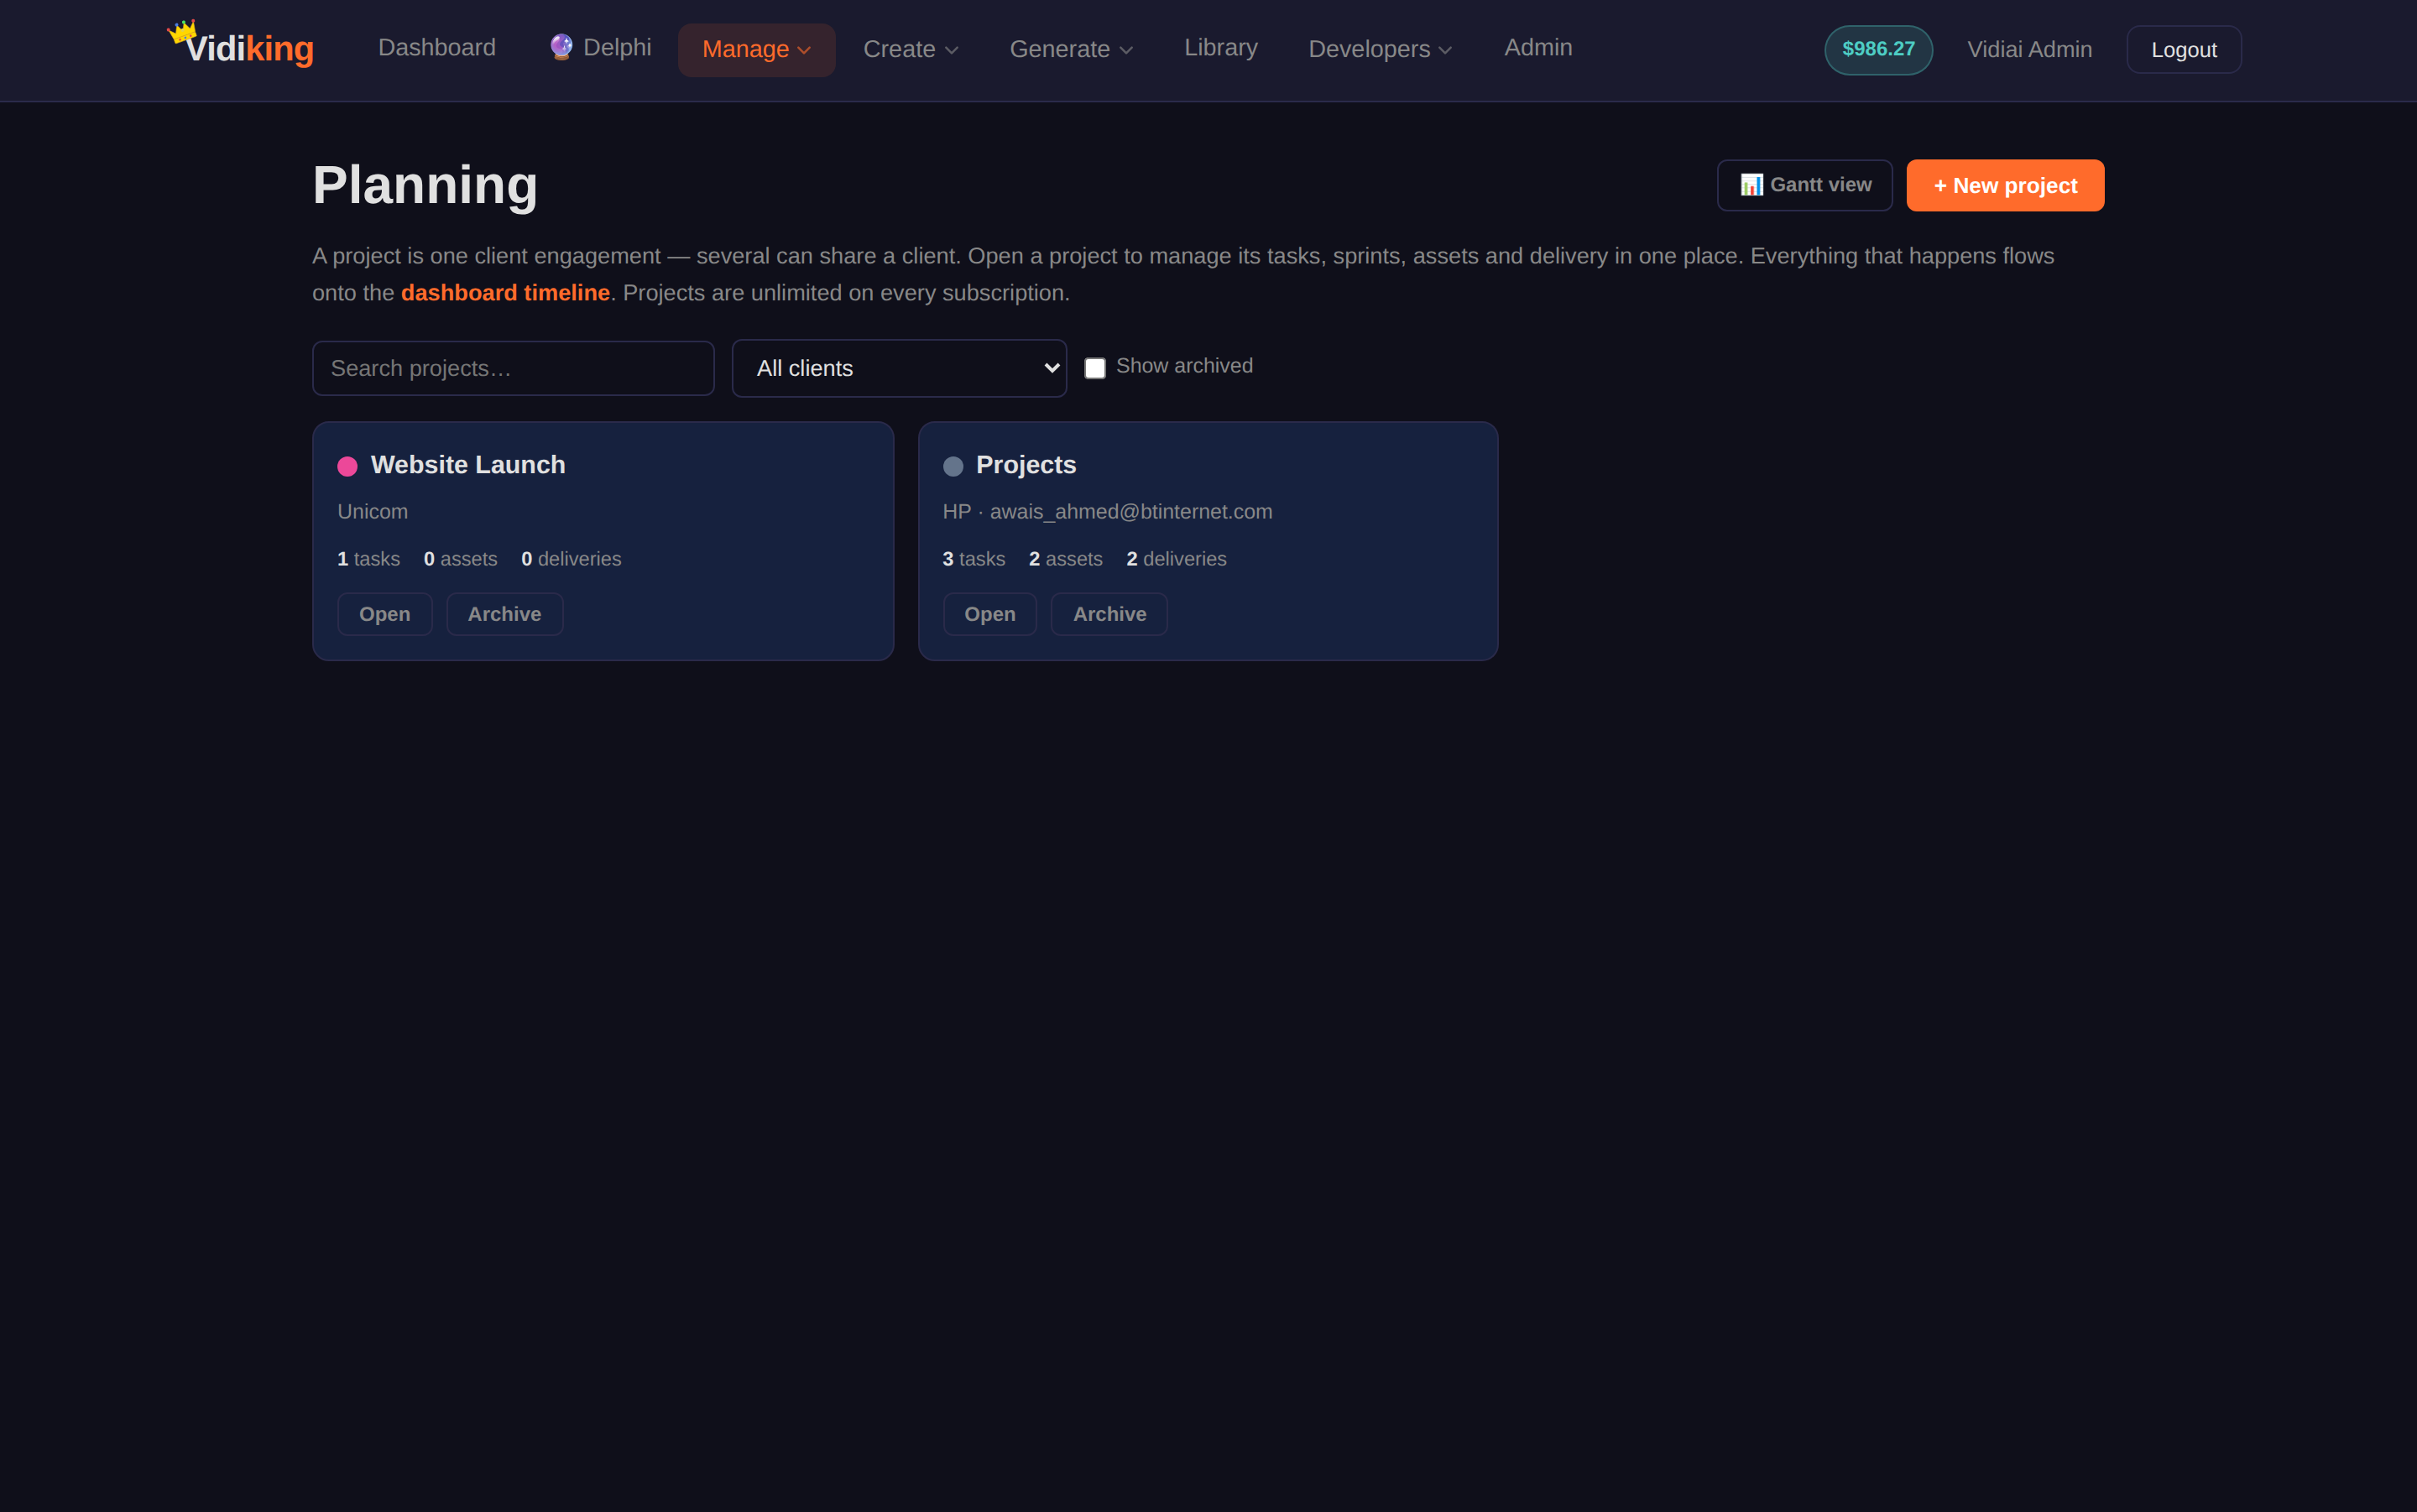
From the project list you can:
- Search projects by name or client,
- Filter by client,
- Show / hide archived projects,
- + New project (managers only) — give it a name, a colour, and optionally a client name and email.
Everything that happens inside a project also flows onto the Dashboard activity timeline (see below).
Inside a project — the five tabs
Open a project (/planning/:id) and you manage all of it in tabs:
| Tab | What it's for |
|---|---|
| Overview | At-a-glance counts (Tasks · Assets · Deliveries) and project status. Your jumping-off point into the other tabs. |
| Tasks | The project's assignable work — owner, due date and status on each. Links out to Requests for full editing and decomposition. |
| Sprints | Optional time-boxes inside the project, with story points and a burndown chart (see below). |
| Assets | Every asset produced for the project, each with an owner. |
| Delivery | The launch canvas — place assets, run internal + customer approval, and take them live. See the Product Launch tutorial. |
Because Tasks, Sprints, Assets and Delivery all hang off the same Project, there's no duplicate data entry — file work under a project once and every tab stays in sync.
The Gantt timeline
For the cross-project schedule view, click 📊 Gantt view on the Planning screen (or 📊 Full Gantt on the Dashboard). It opens at /planning/gantt.
Any task with a start date and due date automatically appears as a bar on the Gantt timeline — there's nothing extra to do. The timeline:
- spans a one-year window with lane-packed bars,
- shows all organisation work to managers, and own work to everyone else,
- reveals the assignee on hover.
Because dates drive the Gantt automatically, keeping start/due dates accurate is your project plan — there's no separate planning artifact to maintain.
Sprints
The Sprints tab inside a project runs time-boxed iterations. A sprint can live inside one project, or be cross-project.
Create and run a sprint
- Create a sprint with a name and dates. Its status starts at
PLANNED. - Toggle it to
ACTIVEwhen the iteration starts, andCLOSEDwhen it ends. - Fill it from the backlog.
The backlog
The Sprints tab shows a backlog — tasks that have no sprint yet. Managers use + Add to assign a task to the selected sprint. (Under the hood this sets the task's sprint; removing it returns the task to the backlog.)
Point stats & burndown
For the selected sprint you get point statistics derived from each task's story points:
- Total points committed,
- Completed points,
- Remaining points.
Below that is an inline burndown chart (drawn as an SVG — no external charting library):
- a dashed ideal line from total points down to zero across the sprint,
- an actual line built from the daily standup history,
- a today marker.
The actual line tracks real progress as your team posts standups, so the gap between ideal and actual is your live signal of whether the sprint is on pace.
Burndown is only meaningful when your tasks have story points set and your team posts standups. Points define the height of the chart; standups draw the actual line.
The Dashboard timeline
The Dashboard (/) shows a single chronological activity timeline instead of the old swimlanes. Each row is an event — a task created or completed (▭), an asset produced (◆), or a review/approval (✦ green = approved, red = changes requested) — plotted on a shared date axis. You can switch the view one project at a time (with an All projects option) using the ‹ › arrows and the project dropdown, and jump to the 📊 Full Gantt from there.
How it all fits together
- A Project is the one place a client engagement lives.
- The Gantt answers "when does everything happen and who owns it?" across the whole year.
- Sprints answer "what are we committing to in this iteration, and are we on track?"
- The Dashboard timeline answers "what just happened, across everything?"
All of them read from the same Tasks, Sprints and Assets, so there's no duplicate data entry.
Next
- Add an executable pipeline with approval gates → Workflows
- See org-wide health and forecasts → AI Project Manager
- Deliver work to a client end to end → Tutorial: a Product Launch